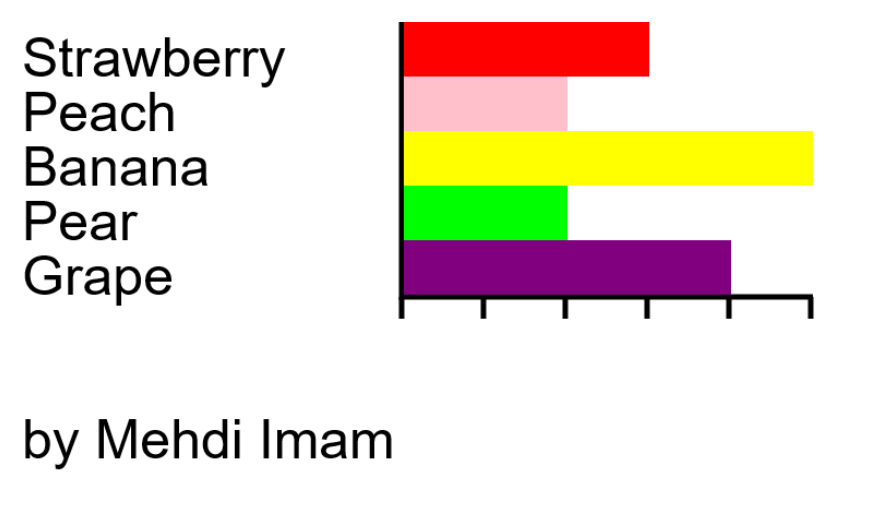
Lab: Color Chart
Used Javascript/Canvas to read in JSON values, using a loop to draw out a bar chart showing the quantity in sales for the fruit.
Welcome to my portfolio! Below you can find my projects.
Used Javascript/Canvas to read in JSON values, using a loop to draw out a bar chart showing the quantity in sales for the fruit.
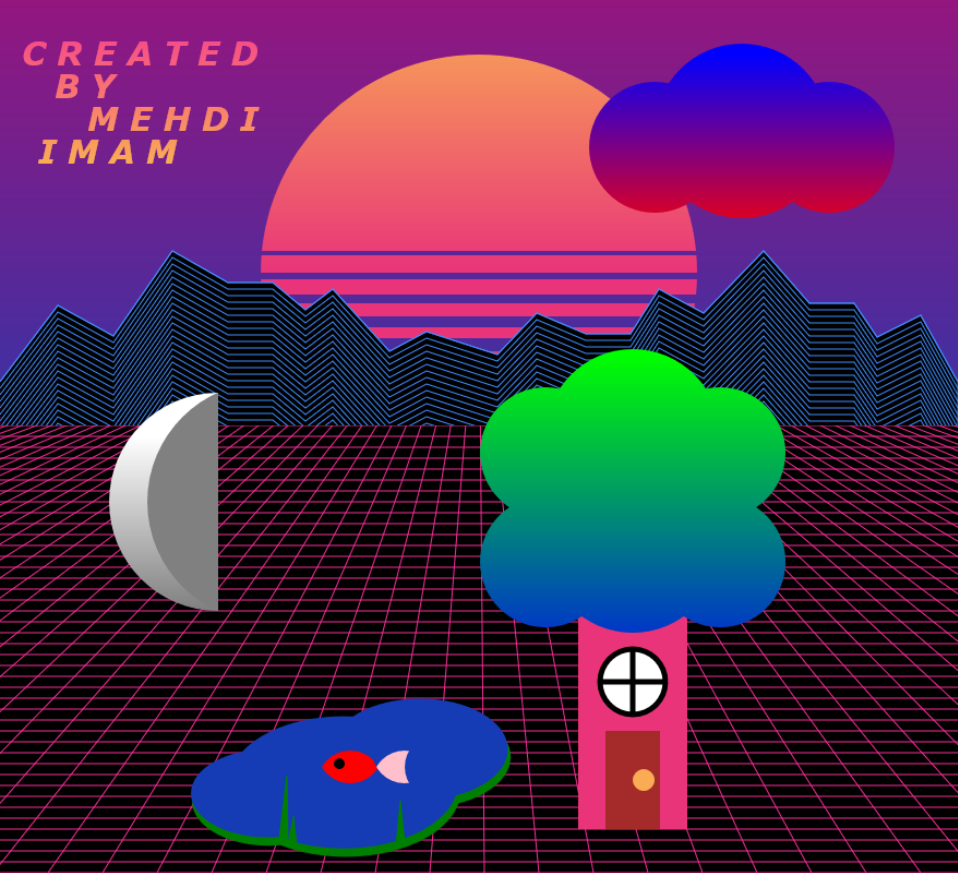
Used a HTML5 Canvas & JavaScript to draw a cartoon on the screen using moveTo, lineTo, fill, stroke, and other JavaScript canvas functions.
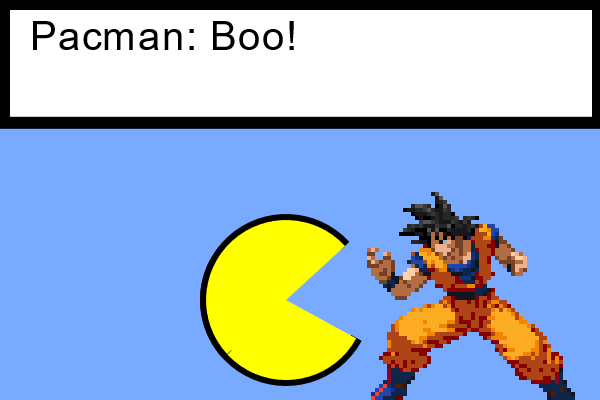
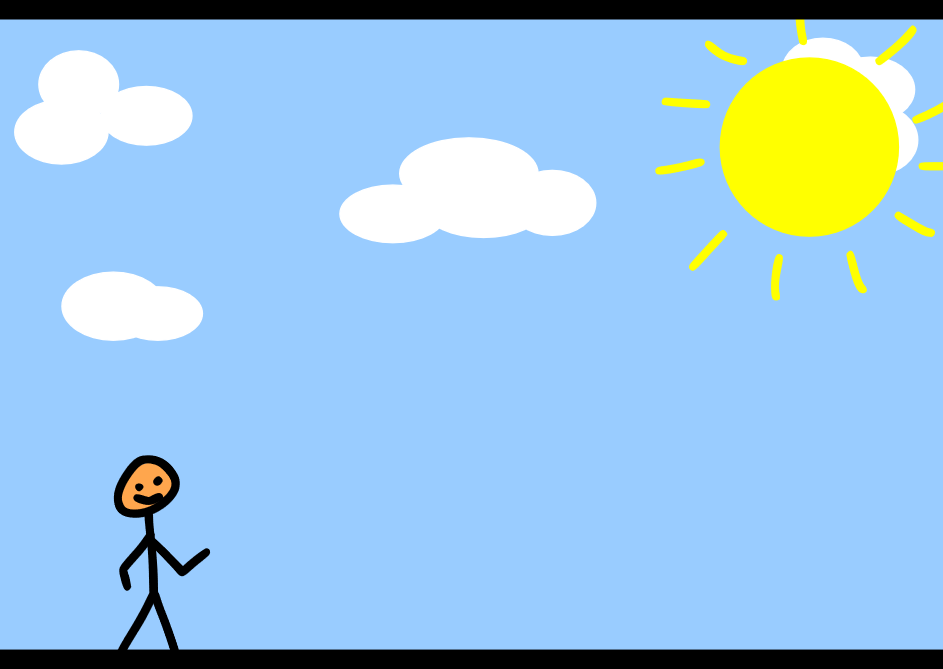
Made an animated scene using HTML canvas. (If the sprite does not show up, refresh the page).
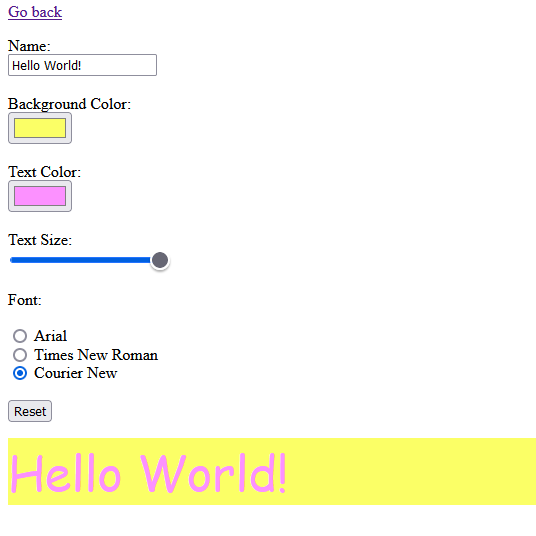
Created a text form that dynamically updates the text on the screen to match inputs using JavaScript. All changes are saved so that when the page is revisited, the form is filled out the same way. There is a reset button to reset the form and text.
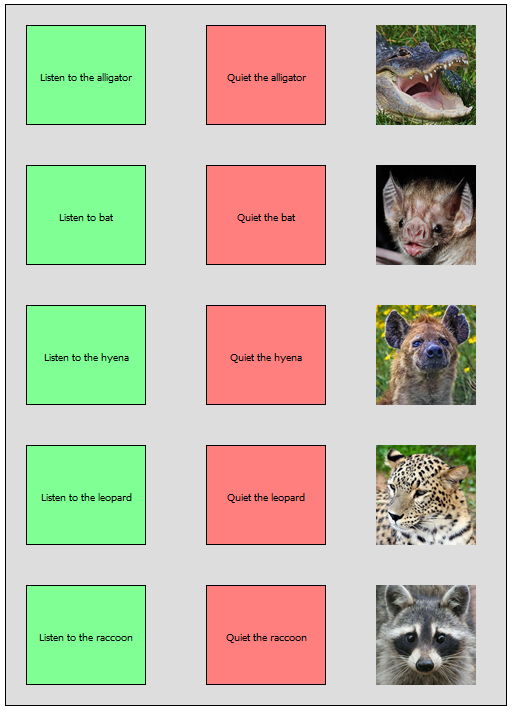
Created a sound machine that can play and stop the audio from five different animals.
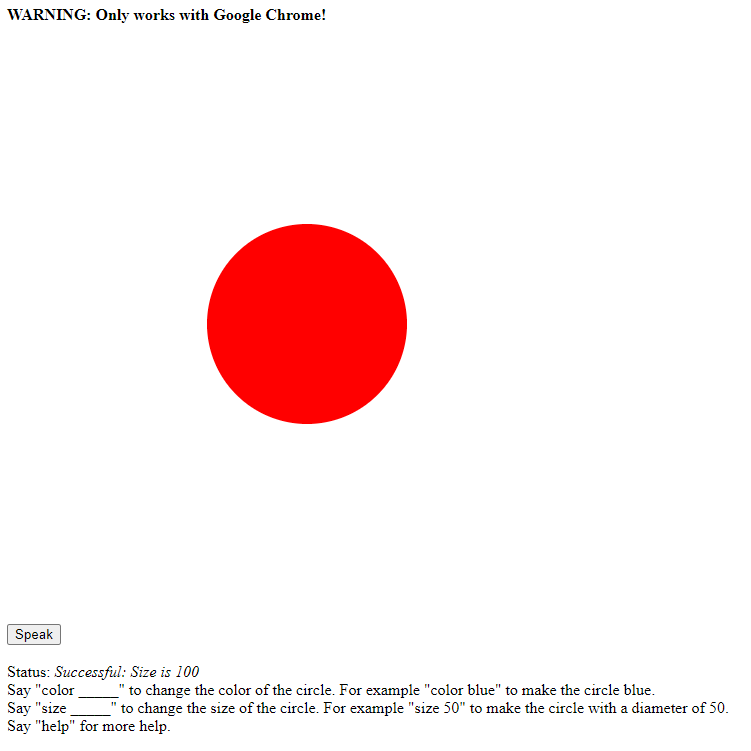
Used Web Speech API to allow user to input voice commands that change the color and size of a circle on screen.
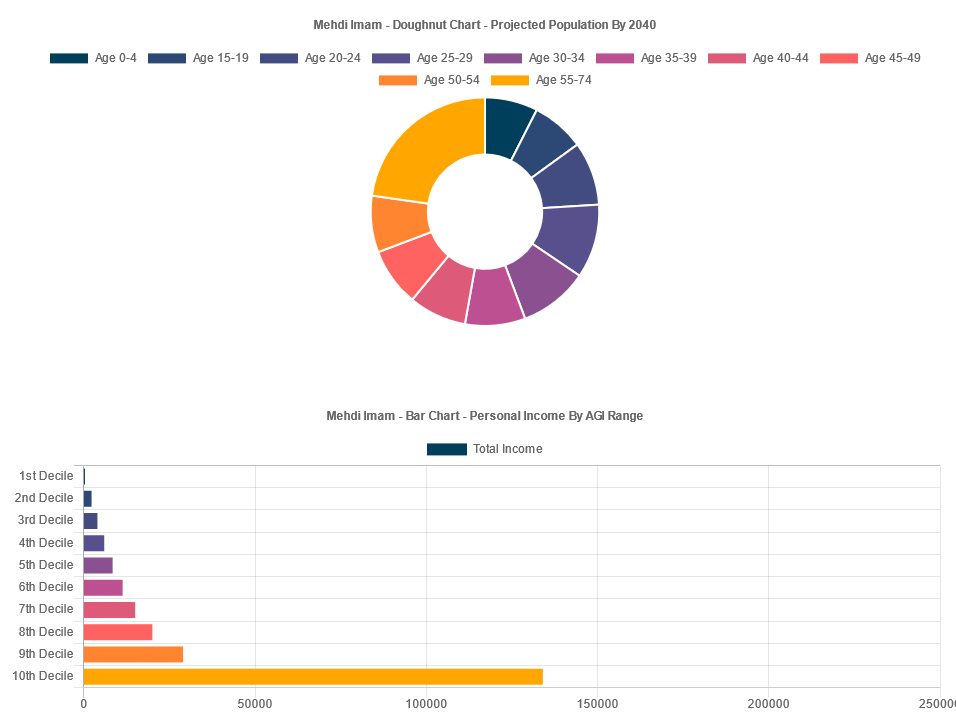
Used Chart.js to visualize data from NYC OpenData in the form of a doughnut chart and a bar chart.
Created an animation using Wick Editor and exported as an HTML. Edited it so that the .wick file is also available for download.
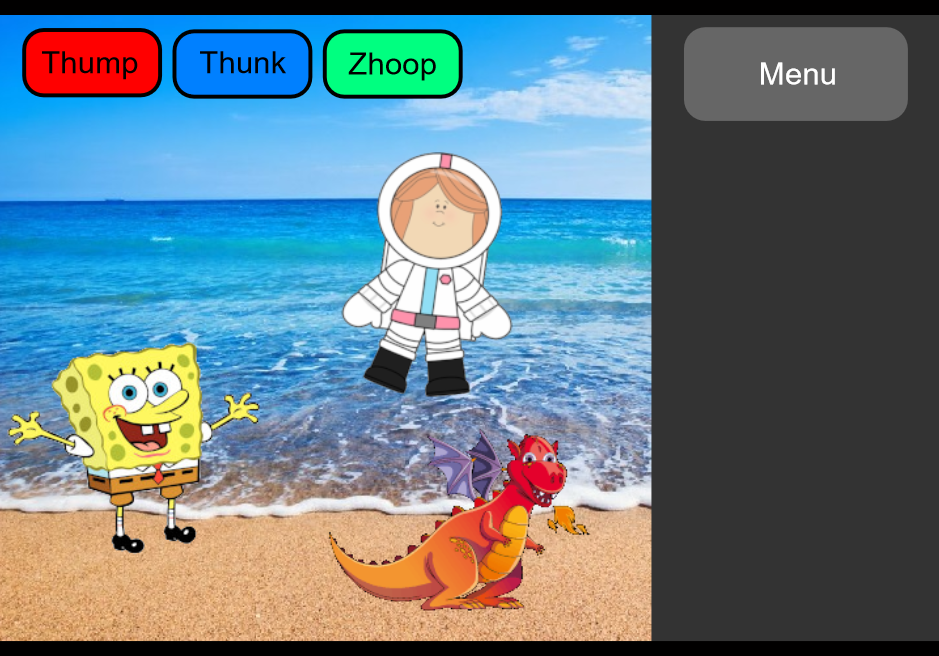
Created an interactive page using Wick Editor and exported as an HTML. Features background music, a scene menu, draggable characters, and sound effect buttons. Might take a while to load.